

Viewing Sessions
Monitor and review AI activity in the dashboard.
A session is a single connection between your AI tool and Edison Watch.
The Sessions View
Go to Sessions in the sidebar to see all activity.


| Column | Description |
|---|---|
| Date/Time | When the session started. |
| Session | Unique ID (hover for full ID). |
| User | The person who started the session. |
| Data Access | Colored dots showing Private, Untrusted, or External activity. |
| Risk | Low (green), Medium (amber), or High (red). |
| ACL | Highest sensitivity level accessed (PUBLIC, PRIVATE, SECRET). |
| Tool Calls | Total number of AI actions in the session. |
Session Details
Click Show on any row to see the full timeline:
- Timeline: Chronological list of every tool the AI used.
- Parameters: Exact arguments passed to the AI (click Expand for details).
- Status: Whether each call was successful, blocked, or pending.
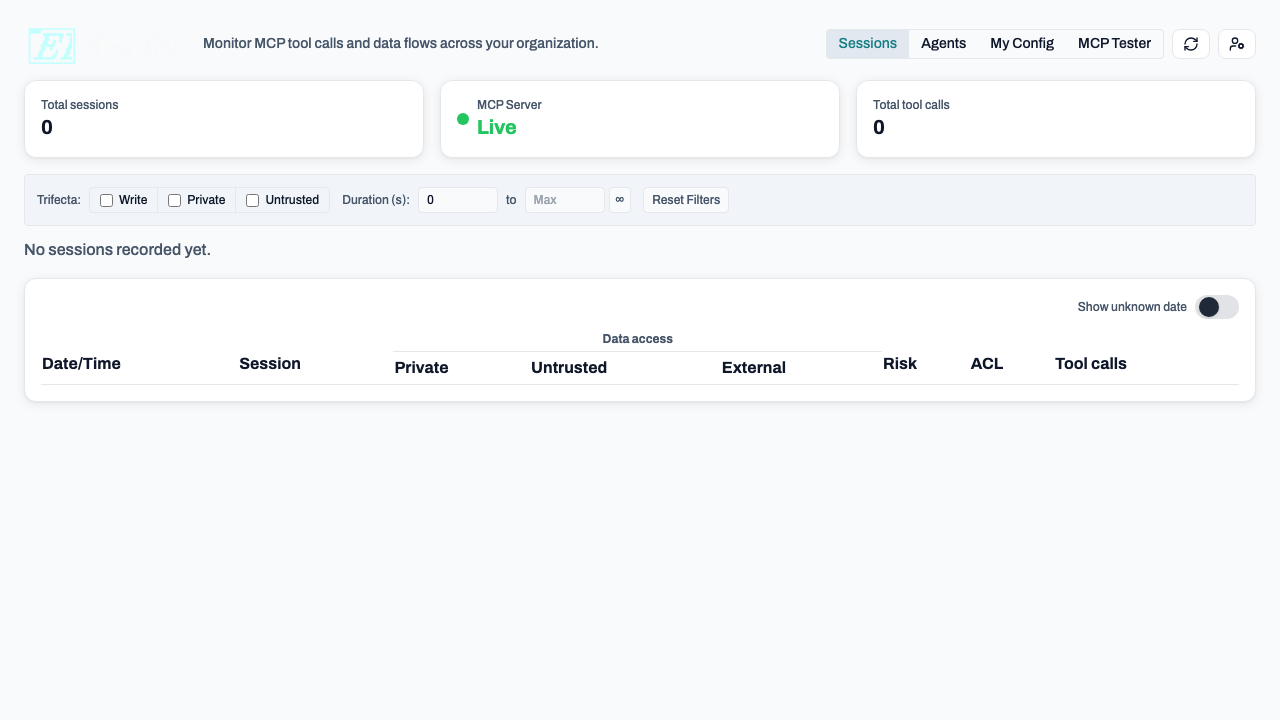
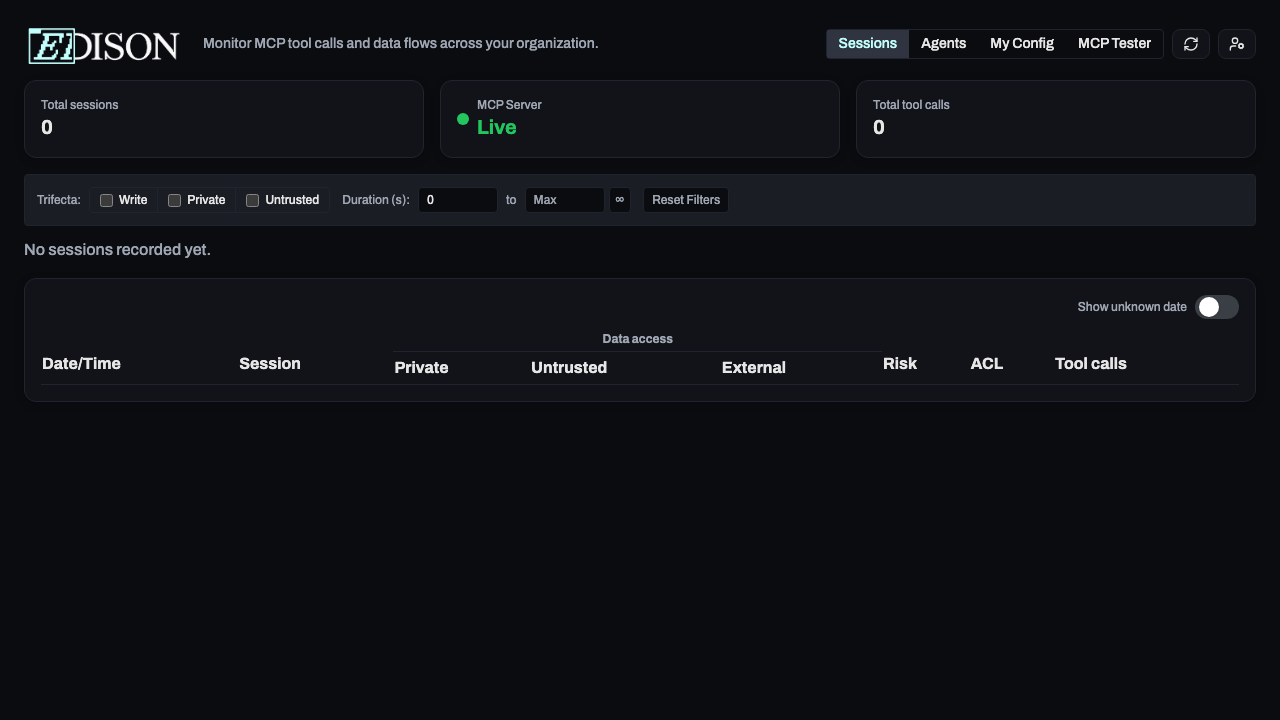
Filtering
Use the toolbar to find specific activity:
- Trifecta: Filter by Write, Private, or Untrusted flags.
- Duration: Find sessions based on how long they lasted.
- Date Range: Use the slider at the top to select a time period.
- Users: (Admins only) Filter by specific team members.
ACL Levels
The ACL column indicates the most sensitive data handled:
| Level | Meaning |
|---|---|
| PUBLIC | No sensitive data accessed. |
| PRIVATE | Internal/confidential data accessed. |
| SECRET | Highly sensitive data accessed. |
Pro Tip: Combine filters to investigate risks, like "High-risk sessions that accessed SECRET data."