

Dashboard Overview
Navigate the Edison Watch dashboard and understand its main features.
The dashboard is your command center for monitoring AI activity. This page walks you through the main interface.
The Main Screen

Navigation Bar
At the top, you'll find navigation tabs:
| Tab | Purpose |
|---|---|
| Sessions | View all AI sessions and their activity |
| Agents | See agent activity patterns and dataflows |
| My Config | Your personal MCP server configuration |
Admin-Only Tabs
If you're an admin, you'll also see:
| Tab | Purpose |
|---|---|
| Users | Manage users and their API keys |
| Roles | Configure access control policies |
| Policies | Set up security policies and rules |
| Servers | Manage MCP servers for the organization |
| External Config | Configure SIEM integrations and server endpoints |
| Advanced | Access advanced system configurations |
User Menu
Click the user icon in the top-right to access:
- Your email and role
- Download options for logs and session data
- Sign out
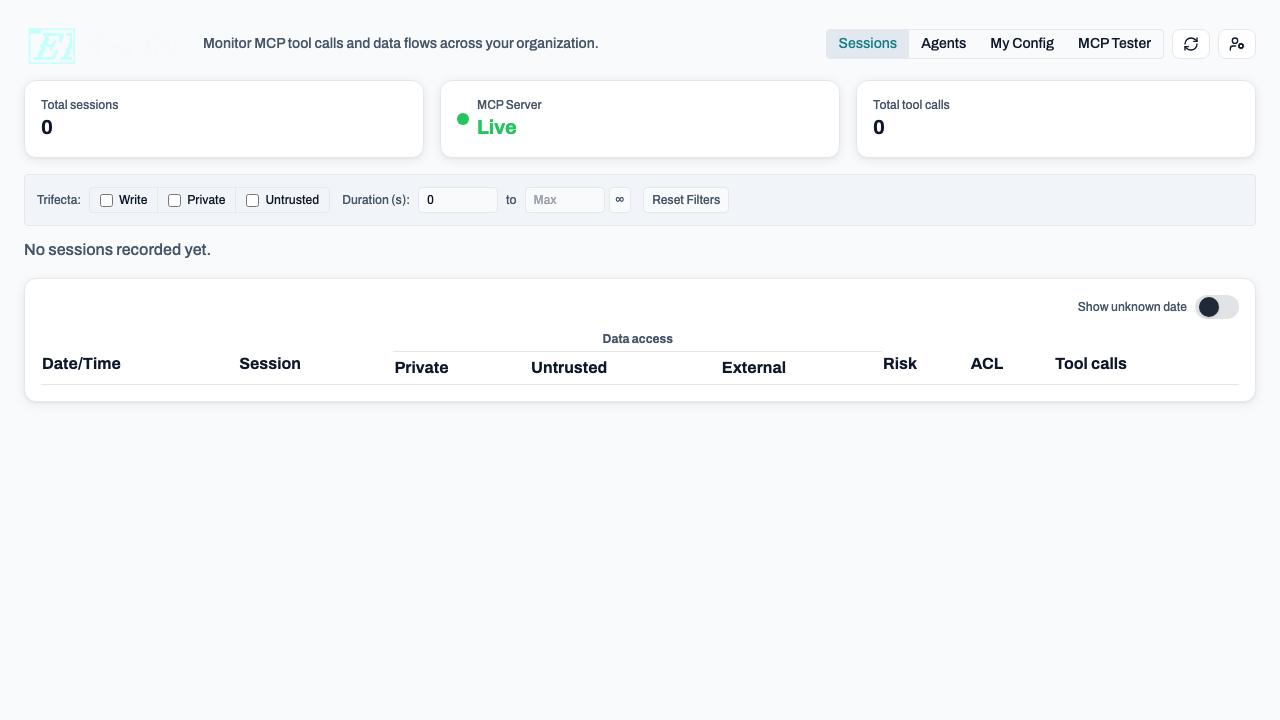
Sessions View
The Sessions view is your primary monitoring interface:

KPIs
At the top, quick stats show:
- Total sessions in the time range
- Total tool calls made
- Risk distribution
Filter Toolbar
Filter sessions by:
- Users (admin only): Focus on specific users
- Trifecta flags: Write ops, Private data, Untrusted data
- Duration: Session length in seconds
Date Range Slider
Drag the handles to focus on specific time periods.
Sessions Table
Each row shows:
- Date/Time of the session
- Session ID
- User email
- Security flag indicators (colored dots)
- Risk level
- ACL level
- Number of tool calls
Click Show to expand and see all tool calls for that session.
Understanding Security Flags
The dashboard uses colored dots to indicate security state:
| Dot | Color | Meaning |
|---|---|---|
| Private | Blue | Session accessed private/sensitive data |
| Untrusted | Amber | Session fetched external/web content |
| External | Red | Session made external communications |
When you see all three dots, the session triggered the "Lethal Trifecta" check.
Risk Levels
Sessions are assigned a risk level based on their security flags:
| Level | Flags | Color |
|---|---|---|
| Low | 0 flags | Green |
| Medium | 1 flag | Amber |
| High | 2+ flags | Red |
ACL Levels
The ACL column shows the highest data classification accessed:
| Level | Meaning | Color |
|---|---|---|
| PUBLIC | No sensitive data | Green |
| PRIVATE | Confidential data | Amber |
| SECRET | Highly sensitive data | Red |
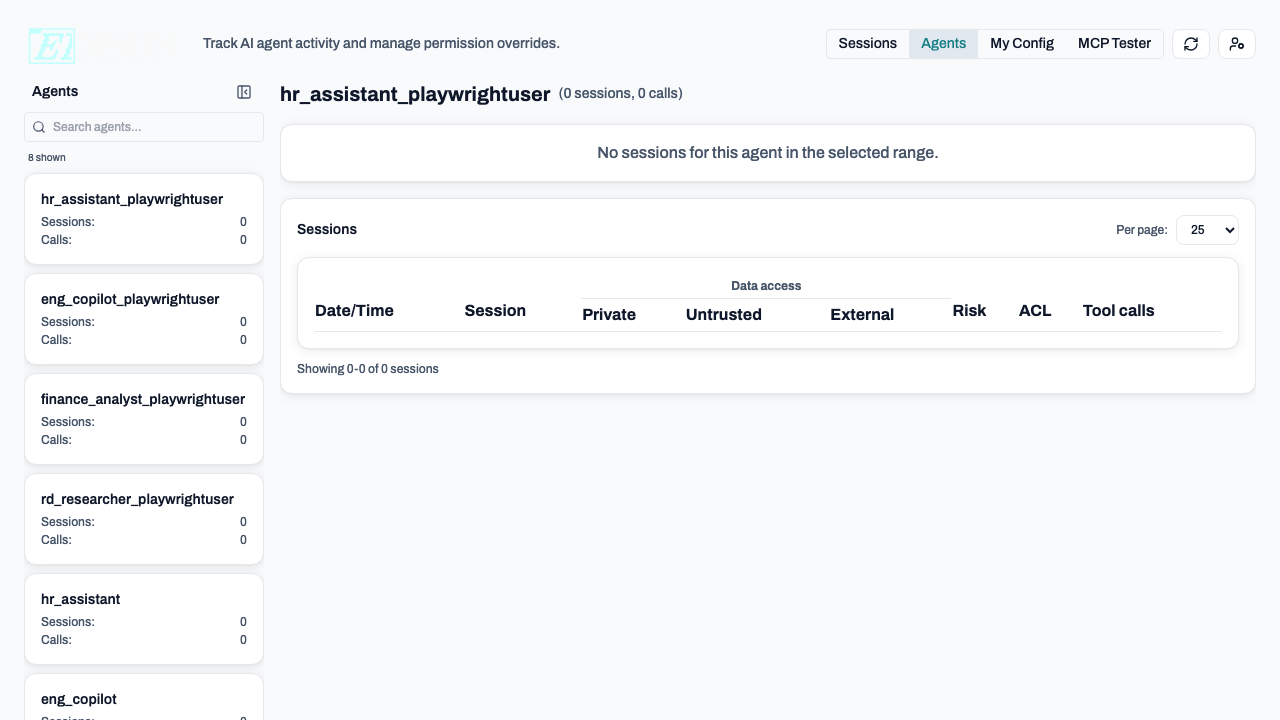
Agents View
The Agents view shows:
- Agent activity patterns
- Data flow visualizations
- Tool usage statistics
My Config View
The My Config view lets you:
- View your personal MCP server configuration
- See which servers are available to you
- Configure user-specific server settings
- Manage privacy settings including PII obfuscation
See PII Obfuscation for details on protecting sensitive data in tool results.
Tip: Use the date slider and filters together to investigate specific time periods or suspicious activity patterns.