Dashboard Overview
Navigate the Edison Watch dashboard and understand its main features.
The dashboard is your command center for monitoring and controlling AI activity across your organization.
Layout

The dashboard uses a sidebar on the left for navigation and a main content area on the right.
Sidebar Navigation
The sidebar is grouped into sections based on your role:
| Section | Visibility | Entries |
|---|---|---|
| User | All users | Sessions, My MCPs |
| Admin | Admins | Overview, Users, Servers, Access Control (expands to Policies, Roles, Permissions) |
Settings is not a sidebar entry - open it from the user-menu dropdown at the bottom of the sidebar (along with Sign Out and theme controls).
Header
Most pages show a Docs link in the header (book icon) that opens the documentation for that page.
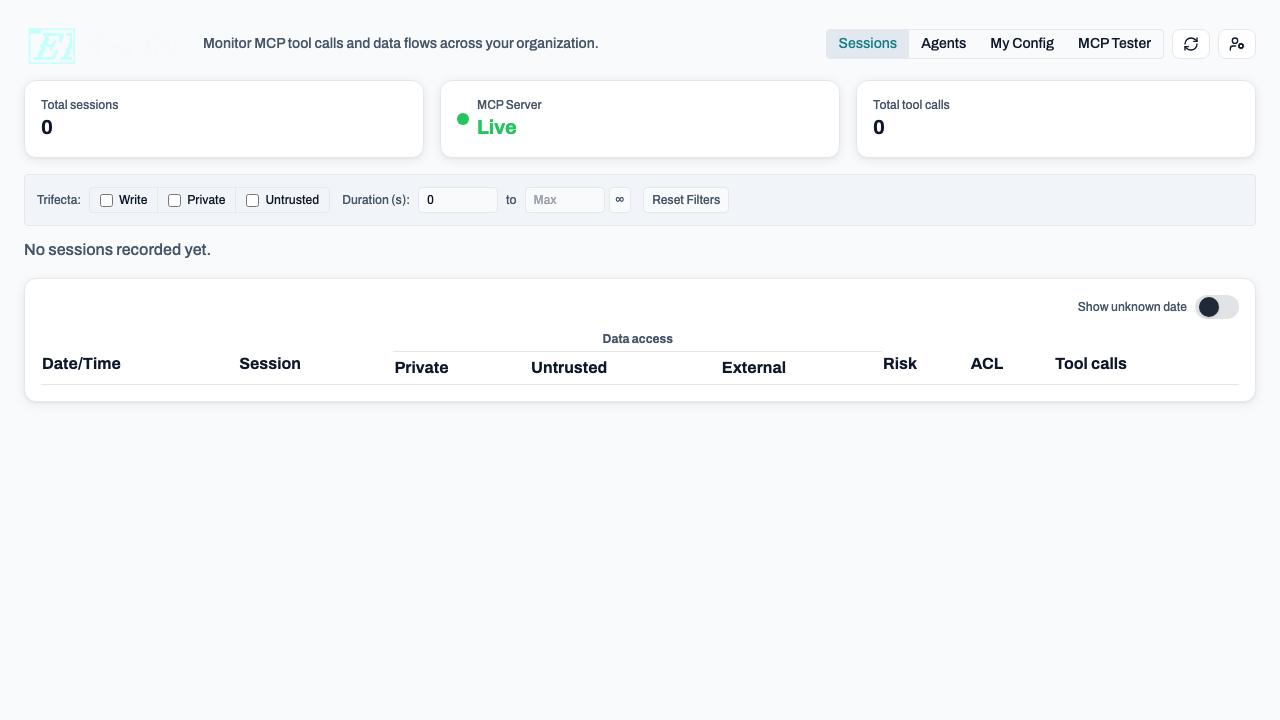
Sessions View
The Sessions view at /dashboard/sessions is the default landing page after sign-in and the primary monitoring interface for all users.

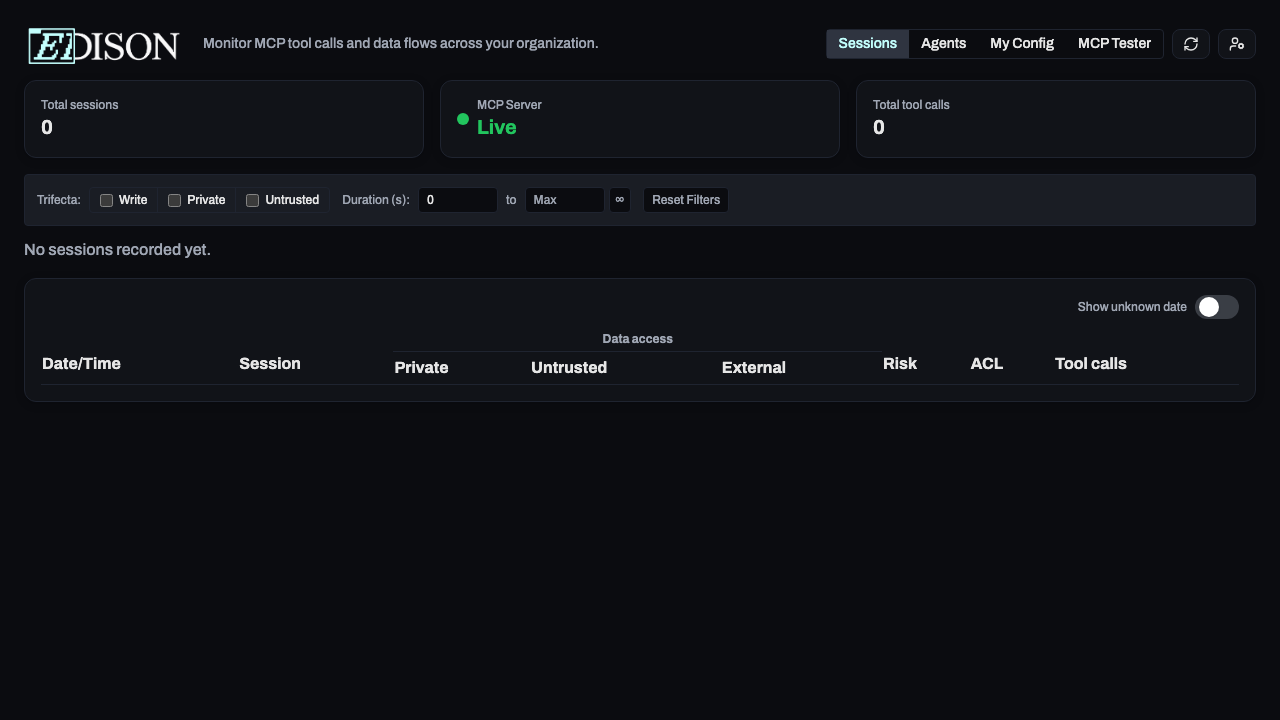
Each row in the sessions table shows:
| Column | Description |
|---|---|
| Last Active | When the session last had activity. |
| User | The person who started the session. |
| Agent | The AI agent (e.g. Claude, Cursor). |
| Calls | Total tool calls in the session. |
| Status | Active, completed, or blocked. |
| Risk | Low (green), Medium (amber), or High (red). |
| ACL | Highest sensitivity level accessed. |
| P/U/E | Colored dots: Private (blue), Untrusted (amber), External (red). |
Click any row to expand the full tool call timeline.
Overview Page (Admins)
The Overview page (/dashboard/overview) is the admin dashboard. It shows:
- Pending server requests - users requesting access to new MCP servers.
- Pending quarantine requests - servers blocked by the client app awaiting approval.
- Security insights - recent policy violations and risk patterns.
Understanding Security Flags
Edison Watch tracks three data-flow flags per session:
| Flag | Dot | Triggered by |
|---|---|---|
| Private data | Blue | Reading files, databases, or internal documents. |
| Untrusted content | Amber | Fetching web content or calling external APIs. |
| External comm | Red | Sending emails, Slack messages, or external API calls. |
A session with all three flags set is a Trifecta - the highest-risk combination. Use the Trifecta filter on the Sessions page to find these sessions.
Risk Levels
| Level | Flags | Indicator |
|---|---|---|
| Low | 0 | Green |
| Medium | 1 | Amber |
| High | 2+ | Red |
ACL Levels
| Level | Meaning |
|---|---|
| PUBLIC | No sensitive data accessed. |
| PRIVATE | Internal/confidential data accessed. |
| SECRET | Highly sensitive data accessed. |
Tip: Use the date range filter and security flag filters together on the Sessions page to investigate specific incidents.